

Plumbing the depths - getting into some deep fish farming nerdcore
I was reading through some quarterly reporting recently, partly out of morbid curiosity following a summer that delivered challenging environmental and market conditions and partly as research for my last blog post on the topic of aquaculture site licenses.
Quarterly and annual reports from publicly listed companies contain a wealth of information. One thing that stood out for me, however, was how it would be possible to completely miss the gravity of the situation faced by some farmers if you relied on the narrative and commentary of the reports and overlooked the key statistics that can be somewhat buried in a sea of backward-looking financial statements.
Mortality rates
Farmers tend to be oblique when it comes to mortality rates. They often refer to total mortality rates for closed/harvested groups which are fine from a historical perspective, but if you are attempting to understand the prospects for the company, it is much more important to understand mortality rates for living inventory and how those rates have trended over the past few cycles. A few farmers provide good information on this front – Andfjord and Salmon Evolution are examples, perhaps because their results are something to brag about.
In reports where high mortality rates are an issue, companies studiously avoid providing the actual mortality numbers. Recent examples include Q3 2024 reporting for Grieg Seafood, Masoval and H2 reporting for Atlantic Sapphire, where the results suggest mortality was a major factor in the poor results but finding information on actual mortality rates is a challenge.
To be fair to the companies in the “poor results” category, I don’t think they’re trying to hide from reality or their shareholders, but it is the nature of public reporting to present information in a confident, optimistic manner to protect share prices and investor confidence. Financial reporting inherently does a poor job of predicting future outcomes – particularly in salmon farming with its long production cycle. Given the generally limited mortality information available, you have to dig a bit deeper. Harvest data are a key indicator of production system health.
Harvest data as a predictor of production system health
One of the great things about the salmon farming industry is the degree of transparency. Particularly in Norway where many of the companies are publicly listed and organizations like Nofima, the Norwegian Seafood Council, Sintef, etc. abound. It takes a bit of poking around to figure out what is available, but some of the data can be useful – particularly when you want to look at broader trends.
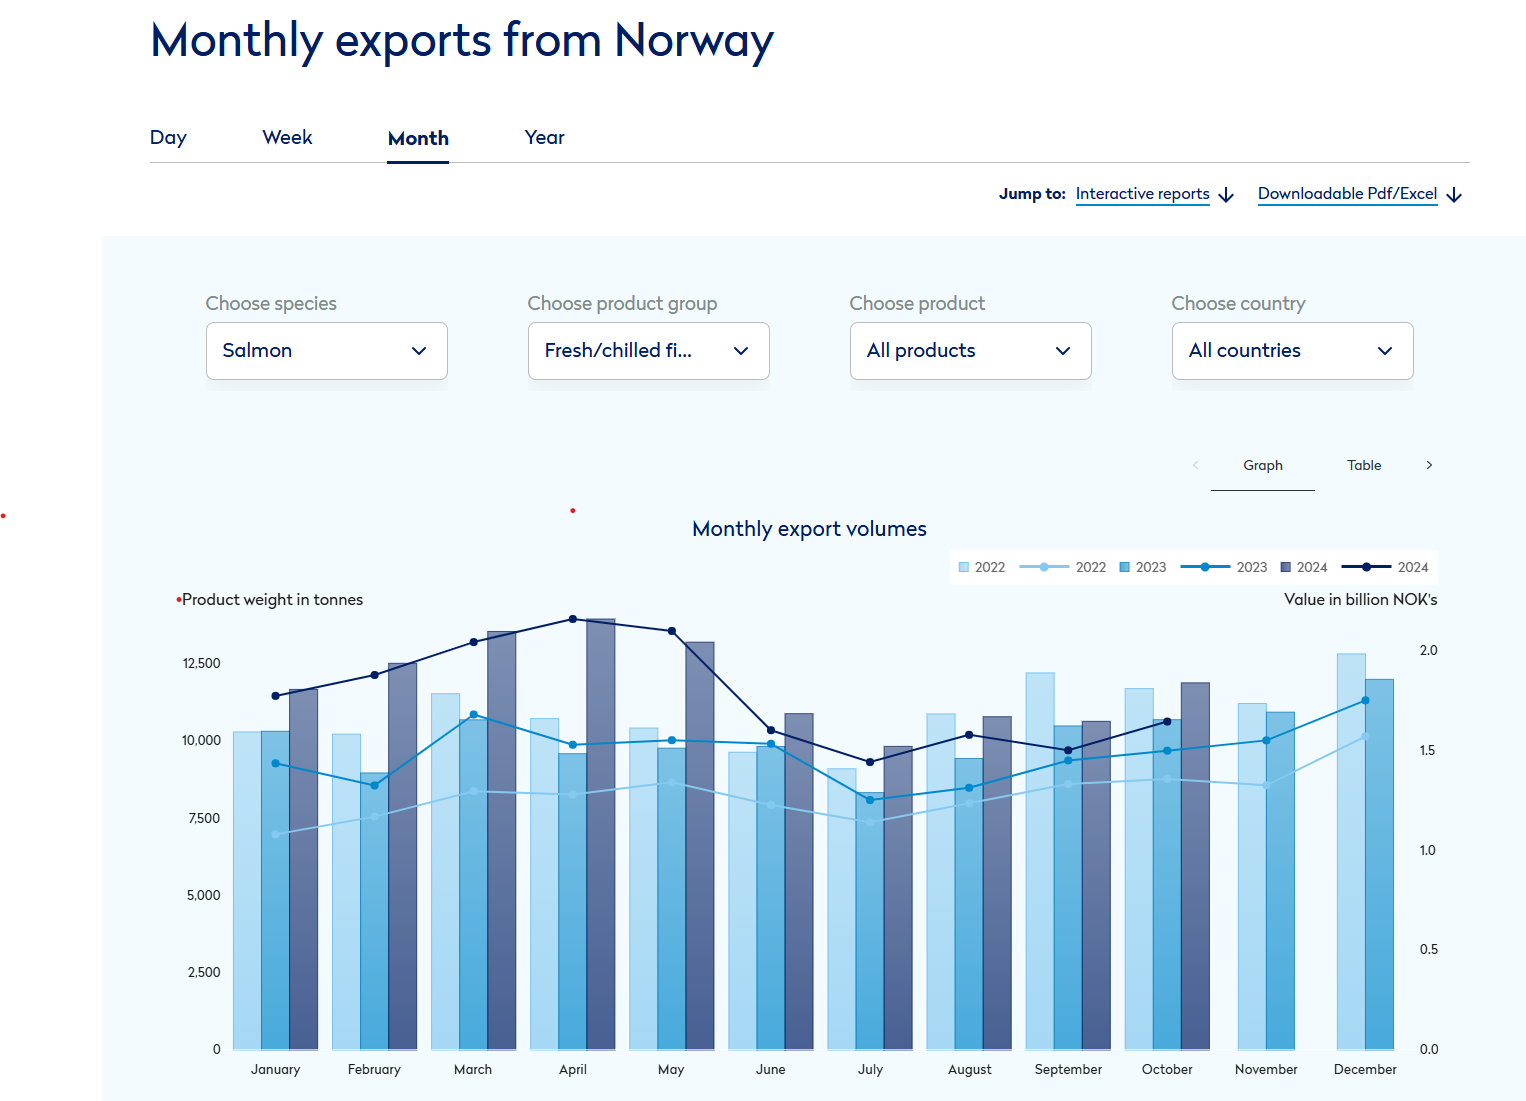
The Norwegian Seafood Council website provides high level data on all types of seafood exported from Norway. In terms of gauging the health of the salmon sector in Norway, one element worth tracking is the split between whole fish and fillets in total exports. Norway has long had a restriction in place on the export of downgraded whole fish. Post-harvest, farmers apply a grading standard to their harvests, blemishes, deformities, maturation and mechanical damage can result in a fish being downgraded. If a fish is downgraded, it cannot be exported in whole fish form and must be processed into fillets or a more value-added product.

Fresh Whole Salmon Exported from Norway
Fresh Salmon Fillets Exported from Norway
The volume of fresh fillets shipped in the first half of 2024 really stands out from previous years. Fillet shipments were up 13% in January, 40% in February, 27% in March, 45% in April and 35% in May compared to the same period in 2023.
When you compare prices for fillets and whole fish, the decision to produce more fillets was not driven by profitability. For April, here is a comparison of fillet prices to whole fish prices.

Norwegian exports fresh fillets and whole fish - April 2024
The normal expectation when a company chooses to produce fillets from premium whole fish is that the price returned for the fillet should be significantly higher than the price for whole fish. In the example above, the return is virtually identical – fantastic prices in both cases, but a lot more effort goes into producing fillets. Outside of Norway, a farmer would have a strategic decision to make in terms of when to produce fillets. Depending on conditions in the market, it might be more cost-effective to accept a discount than to invest in additional capacity for fillet production.
In the Norwegian context, these data support the notion that the massive increases in fillet production is related to a widespread issue with fish condition. It doesn’t mean the sky is falling but it does raise questions about the condition of the livestock heading into a challenging summer period.
Size matters
Another element that can be glossed over by a positive spin in the production narrative is the harvested size of fish. The market size for Atlantic salmon generally 4-5 kgs and up. Fish in the 4-5kg range are ideal for fillet and portion yields and industrial uses, larger fish are more desired for sushi, fine-dining and other premium outlets etc. Below these ranges, discounting can be steep, and fillet and portion yields can be poor. If a farmer is harvesting much below 4kg in average weight, it should raise questions about the status of their farming operation. Here is an example of current pricing in the Northeast US.

Urner Barry Pricing per industry sources - December 2024
The difference between the largest size category and the smallest is 25%. Currently, no pricing is quoted below 4 kg which suggests a further discount would be applied to smaller fish.
When reviewing financial reporting, it is worthwhile paying attention to average harvest weight information when it is provided. A couple of recent examples – on slide 7 of the Grieg Seafood Q3 2024 presentation, they mention an average harvest weight of 3.6 kg, on slide 20 of Atlantic Sapphires H2 presentation, a chart showing average harvest weights is presented. A few things can lead to harvesting small fish, none of them are good. (for the most part)

Example Unit Cost Development
From a cost of production perspective, Atlantic salmon juveniles are very expensive (they are delicate in the early stages, vaccine costs are high, and their nutritional needs are expensive to meet) and it is important to build as much biomass as possible in the lower cost, later portion of the life cycle.

Biomass Gain Compared to Average Weight
In the Grieg example, harvesting fish at 3.6 kg in average weight (not sure if this is a live weight or HOG weight) would have suggested the harvest fish were in month 14 of the production cycle – not bad from a unit cost perspective, but they would have missed out on the 25% of biomass growth that would have been produced in months 15 – 18. So, 25% less biomass than optimal sold at a ~20% discount on price.
The Atlantic Sapphire example is more extreme, in the past 5 quarters, their harvest weights have averaged 1.6kg. That implies harvesting took place in month 8, again potentially not a disaster from a unit cost perspective but implies they failed to realize 62% of planned biomass production. So again, a massive miss on production volume sold at a deep discount. (Some volumes were sold at a Blue House premium per their reporting, but the vast majority would have been deeply discounted.)
*** A note about the production model shown – my model was developed for a client project and won’t apply with any degree of accuracy to Atlantic Sapphire. I just have it here as an illustration. (May not be accurate for Grieg either). The charts are a bit wonky because of some assumptions made around sea lice treatments.
So why would a farmer harvest such small fish?
I’m getting to the point – honest. There are three main reasons why farmers would harvest small fish, and it will pay to ask the question if it isn’t spelled out. I’ll go from most likely to least likely.
Most likely – they don’t have control of their production system and the alternative to harvesting small fish is letting them die. The fish may have a virus, been badly impacted by jellyfish, have been hit with a plankton bloom, or the farmer is unable to control sea lice. I’ve experienced this firsthand and as much as it stinks to harvest small fish, it is far worse to watch them die. In addition to getting punished on pricing and biomass development, small fish are generally more expensive to process.
Next most likely – they need the cash. Salmon farming is a cash-intensive business, and they may need cash to come in the door even if they aren’t fully grown. Occasionally, if the market demand is high, it may make strategic sense to harvest small fish – for example, if you have a fish that is just under 4kg in average weight in June, it may make sense to harvest early when prices are stronger rather than waiting until August when prices are normally weakest.
Least likely (in today’s context) – in Norway, farmers plan for maximum production from their sites. For example, if a farmer has a maximum allowed biomass (MAB) of 4,000 tons, they will plan their production to hit that ceiling when the fish are at a marketable size. On a farm with 1 million smolts and an assumed mortality of 15% for the cycle, the MAB would be hit when the fish are somewhere around 4.3 kgs average weight. If things go extremely well with the farm and the mortality is significantly lower – i.e. 5% (challenging today but routine historically) the site may hit the MAB level at an average weight of 3.7kg and be forced to harvest to stay below the cap. Bad news on average price achievement but good news overall.
Final words.
I’m pretty sure this post has killed off even my most stalwart readers. If, incredibly, you have made it this far, you are a true champion, and I salute you.
Feedback and comments can be left below, sent to me via LinkedIn or email at info@AlanWCook.com.